

Pawel de la Bassetière, MS. Economy, review
Outsourcing within the EU has proved to be one of the shifts that has had the largest impacts on the European Union’s economy in recent decades. This took many different forms and evolved with time, but is overall an increasing trend, especially observed in the service sector.
This transition has been facilitated by technological changes, particularly in information and communication technologies, which enabled companies to codify and transfer information and knowledge on a continental scale. Market deregulation and trade liberalisation, including recent EU measures, may have contributed to this phenomenon, though the globalisation of services providing precedes any EU measure. Sometimes assimilated to bestshoring and job delocalisation, in-EU outsourcing and offshoring landscape is often more complicated, as the work is often shared across multiple countries. A classic example can be found in the automobile industry: Czechia and Slovakia have been for over 80 years partners of the German automobile industry.
Outsourcing and offshoring are practises that are related in many ways, and which are used by companies for similar goals. Their meanings are however often confused:
- outsourcing describes a labour management technique that consists in relocating some of a company’s assets, capital, or activities to another company, generally in another country. By outsourcing, a given firm can use the potential and savoir-faire of other companies in different countries while benefiting from several significant advantages, especially in terms of reduction of labour costs. This system of relocation allows for the facilitation of the employment of skilled workers via a job provider in a foreign country. In other words, outsourcing is a form a subcontracting which consists in removing a particular activity from the company and hiring external services (such as the increasingly widespread use of Information Technology in countries with lower wages and highly qualified workforce)-
- By contrast, a company that chooses to offshore only relocates its own industry in a foreign country. Offshoring involves keeping this activity inside the company, while shifting it to a country which offers advantages such as lower labour costs. Offshoring is most often characterised by a company taking the decision to close an industry in its own (home) country to open it in a foreign (host) country. Offshoring can be linked to delocalisation,
The decisions for a company to offshore or to outsource are both driven by a main objective: reducing costs. Additionally, outsourcing is always justified by host countries advantages such as the high specialisation of the subcontractor which guarantees high quality while allowing the company to focus and specialise on other sectors.
Between 2003 and 2016, the geographical distribution of offshoring within the European Union shows a clear pattern of movement: predominantly, Western European countries significantly tend to offshore to Eastern countries, whereas the opposite is much rarer[1]. The research problem of this study thus lies in the following questions: why are Central and Eastern Europe chosen as host regions for offshoring? What are the structural and economic reasons pushing companies of Western countries to move there, and particularly to Poland? What are the sectors concerned by this phenomenon?
In order to answer this question, we will focus on Poland. While Poland is not by a long shot the country where people invest more (Hungary and Czechia, on a pro-capita base are considered for investors a better choice), it keeps being a very interesting subject, especially in terms of diversification.
1. Problematics with quantifying offshoring
According to the traditional theories of international trade[2]relocation is thus part of a normal process that is beneficial to growth overall. Location choices are made on the basis of a rational calculation, according to the factor endowments available in the areas concerned. Firms in developed countries are thus led to relocate low-tech production that has reached maturity. With little innovation, developing countries take over these products while developed countries, continuing to innovate, have an advantage in specialising in the production of goods with higher added value. Reciprocal specialisation thus allows an exchange that is beneficial to all partners. This effect, known as “substitution/compensation”, occurs over time: in the short term, relocations lead to the destruction of low-skilled jobs at local level (certain regions) in the country of origin, but these losses are compensated for at macro level (country) in the longer term because the improvement in the competitiveness of companies leads to an increase in market share and the creation of new, more skilled jobs. Offshoring is thus a normal part of a globalised economy and, according to OECD (2007) studies, this pattern is empirically verified.
There is no need to recall how vague the notion of offshoring is and how difficult it is to measure, both in hosting and offshored countries : the problem is classically studied in the French School of Economics (Arthuis, 2005; Aubert and Sillard, 2005; Bouba-Olga, 2006; Mouhoud, 2006). Quantification requires the identification of the phenomenon and the only identifiable (and therefore measured! ) offshoring processes are those that answer to the definition stricto sensu. The strict definition consider that there is offshoring if a ‘foreign’ production area is totally substituted by a country national production area: offshoring is defined as the closure of a production unit on national territory followed by its reopening abroad, with a view to re-importing the goods produced on national territory and/or continuing to supply the export markets from this location (Fontagné and Lorenzi, 2005). It is not the purpose of this paper to point out that this view underestimates the phenomenon by going into the details of the biases inherent in each measurement attempt (Chanteau, 2008; Coris and alii, 2010) and that, consequently, policy recommendations and measures should not be based exclusively on this quantification. The OECD (2007) itself insists that ‘in the absence of a systematic survey of offshoring, no measurement attempt can provide a satisfactory understanding of the phenomenon’. The lack of measurement tells us nothing, either way, about the interplay of the substitution effect. Earliest studies from the ’90 on the Tech Industry were brought on extremely complicated models that it is not our subject to discuss here. It is important however to underline that a few key indicators where set apart and presented as relevant.
1.1 Main indicator : Foreign Direct investment
A good indicator of the evolution of offshoring through time is the Foreign Direct Investment of a country, which refers to the international movements of capital made for the purpose of creating, developing, or maintaining a subsidiary abroad.
Following the collapse of the Soviet Union, the 6 EU countries that used to be part of the Warsaw Pact (Romania, Poland, Bulgaria, Czechia, Slovakia, and Hungary) have considerably evolved in their economic structure and production. Their entry in the European Union has accelerated the development of their infrastructures, reducing year after year the gap that they had with Western Europe. This development of infrastructure and political stability allowed for investors from more developed European countries to focus on this region, as those factors are crucial for acquiring the trust of investors from abroad.
The FDI is a driving force of the internationalisation of companies, and covers, among others, the creation of subsidiaries abroad as well as acquisitions, (including intra-group loans and borrowings). [what does that indicator leaves out]
Since the fall of the communist regime and the radical economic liberalisation reforms of 1990, Poland has quickly become a privileged destination in the CEEC zone (Central and Eastern European countries) for foreign investors. In 2019, this Central European Slavic country was the country benefiting from the second highest FDI inflow (15,973,000,000 thousands of USD). In this study, we will analyse the nature of those various forms of relocations in Poland, as well as the factors influencing them. In terms of net inflows in the CEE region, Poland (15,973,000 thousands of USD) is preceded only by Hungary (32,049,970 thousands of USD), and is ahead of the Czech Republic (9,332,858,000 thousands of USD), Romania (6,911,103 thousands of USD), Estonia (2,962,634,000 thousands of USD), Slovakia (2,312,686,000 thousands of USD).[3]
Fig.1 Foreign Direct Investment in Poland from 1996 to 2019, in EUR Million
Source: Foreign Direct Investment in Poland from 1996 to 2019, in EUR Million https://tradingeconomics.com/poland/foreign-direct-investment 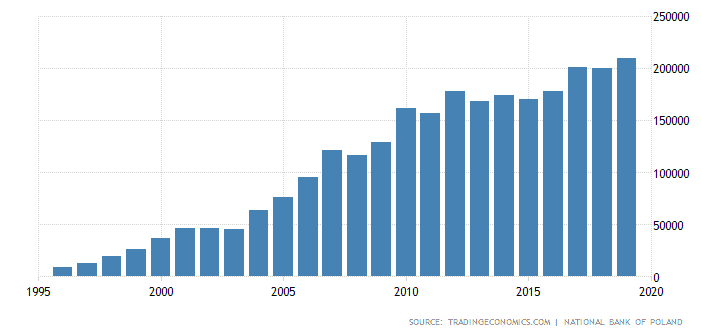
As seen on the graph above, FDI in Poland has almost continually increased since 1996, at a faster rate than general inflation. FDI in 2019 (EUR 209504.80M) has been multiplied by 22,7 times since 1996 (EUR 9228.20M). Since the fall of communism in Poland, the country has become increasingly attractive for foreign investors. This can be explained, among others, by the much lower costs of labour (almost 2,7 times lower than the EU average in 2019)[4].
Fig.2 Foreign direct investment, net inflows (BoP, current US$) – CEE Region
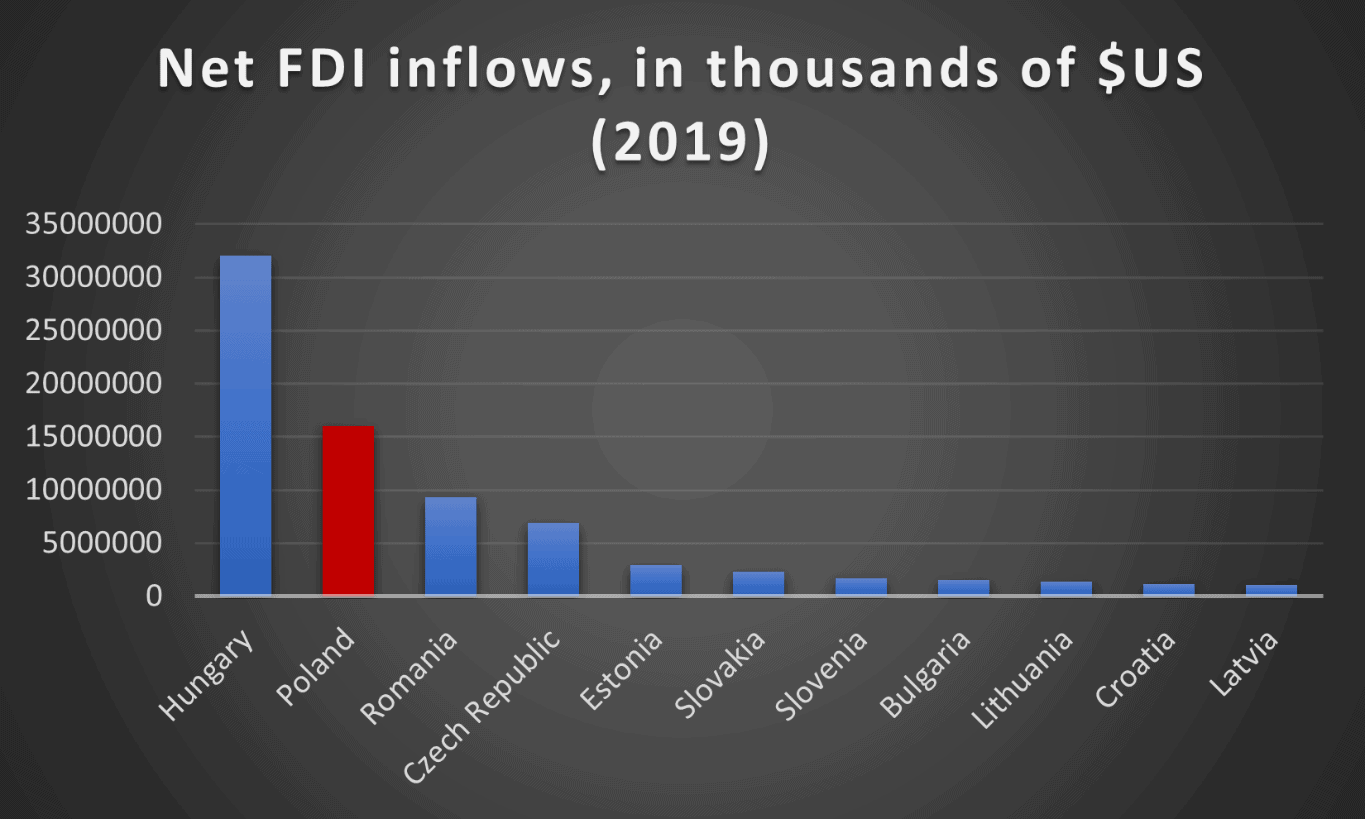
Self-made graph made with data from: https://data.worldbank.org/indicator/BX.KLT.DINV.CD.WD?end=2019&locations=EU&most_recent_value_desc=false&start=1970&view=chart
1.2 From Western Europe to Eastern Europe
Offshoring operates essentially from the West to the East – from the “Europe of the Fifteen” (the 15 states that were part of the EU after the 1995 enlargement of the European Union: Belgium, France, Germany, Italy, Luxembourg, Netherlands, Denmark, Ireland, United Kingdom, Greece, Spain, Portugal, Austria, Finland, Sweden) towards the Member States that joined after the 2004 enlargement of the European Union (Poland, Czech Republic, Latvia, Estonia, Lithuania, Slovenia, Slovakia, Hungary, Romania, Bulgaria, Croatia, Cyprus, Malta).[5] Indeed, when a factory leaves one of the countries in the EU15 group to be relocated, in 44.8% of cases it is an EU13 country that is chosen as the destination (compared to 18,2% of the cases towards a EU15 country).[6]
This clusters very well when we focus on the number of enterprises with foreign capital participation in Poland. The number of enterprises has been multiplied by 1,82 from 2000 to 2020, while the value of foreign equity of undertakings with foreign equity participation has been multiplied by 3,127 (from PLN 65 213,3M in 2000 to PLN 203 897,8M in 2015). This indicates a constantly increasing interest in Poland by foreign investors.[7]
1.3 IT outsourcing
Information Technology is an increasingly relevant sector to focus on when analysing relocations in the European Union. Indeed, EU companies outsource in average 20% of their IT processes, and most of them plan to increase this share, mostly to become more competitive[8]. This can be quantified by assessing the market revenue in this sector, which is constantly growing since 2016 (from $93.12 billion in 2016 to $103.9 billion in 2021[9]. According to the annual study published by in4ma in 2016, 50.3% of the European production value of electronics subcontractors was carried out in Eastern European countries, compared to 49.7% in Western Europe. In addition, a study conducted by Wojciech Piotrowicz and Damian Kedziora in 2018 shows that Poland holds a position of leader in the CEE region in terms of outsourcing of Information technology, being the “second largest remote services delivery hub in Europe”.[10]
Polish developers are among the best in the world, obtaining the 3rd place in the Hackerrank ranking, and the 5th place in the top coder ranking.[11] Moreover, the country’s socio-economic stability and constant development as well as its EU membership make international companies feel secure for outsourcing there.
Furthermore, With the increasing significance of IT services in the functionality of companies, the greatest current challenge is the improvement of IT services and their elasticity. Considering the growing competition, lowering the costs of IT services is one of the objectives of companies, and Poland seems to offer a unique comparative advantage in this sector.
Empirical evidence has shown that the political and institutional factors of a country are highly decisive when it comes to Foreign Direct Investment, as they create a general environment which can be either favourable or inclement for businesses.[12] When investing abroad, a company is highly inclined to evaluate criteria such as GDP etc
2.1. GDP Growth: the Polish Green Island
Fig.1: GDP growth rate of Poland from 1990 to 2019
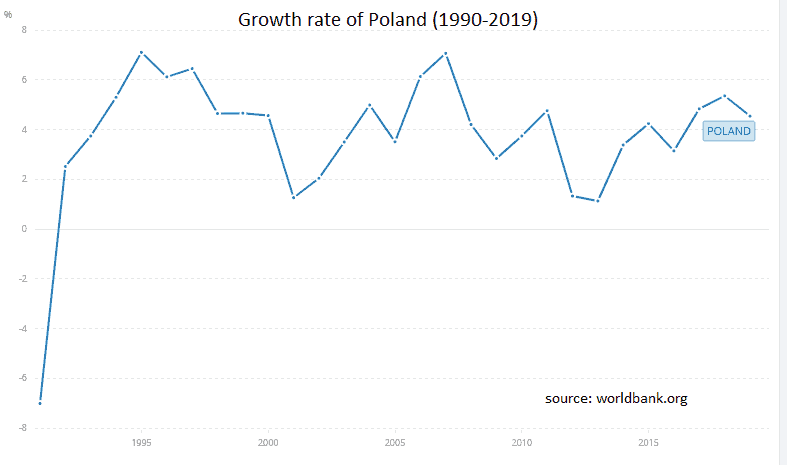
Source: https://data.worldbank.org/indicator/NY.GDP.MKTP.KD.ZG?locations=PL
Before the 2020 COVID pandemic, Poland had never known a growth rate inferior to 1,12% since 1992[13]. This country is known as the European “Green island”, as it does not seem to endure crises: it has stood out in the European Union by “surviving” the 2007-2008 subprime crisis. Indeed, in 2009, when the EU was facing a very deep recession, Poland was the only one to see its economy grow. (2,83% growth rate in 2009). Overall, the Polish GDP has grown by 7 times since 1990, making it the largest growth among OECD countries.[14]
2.2. Cost of labour
Fig.4. Estimated labour costs per hour (2019)
Source: Eurostat (online data code: lc_lci_lev)
According to fig.5, Poland has one of the lowest costs of labour in the European Union. Employing a worker in Poland costs in average 10,7 euros, which is almost 4 times lower than in Belgium (40,5) and France (36,6). This is mainly explained by low taxation and lower GDP per capita, which allow for a substantially lower hourly cost.
2.3. Quality of the Workforce
Foreign firms look for countries of destination where the workforce is skilled and has at least an average level of education. The quality of the local workforce is essential for foreign investors who recruit their future employees in a host country. (source : EVIAN) A workforce with good basic knowledge will be easier to train and will reach maximum productivity more quickly than a less educated workforce. Labour costs and labour productivity are essential ingredients for the competitiveness of products on the international market.
Compared to other countries with similar GDP, Poland has a very qualified workforce. In 2018, 44% of young Polish people had completed higher education.[15] Among those who have completed their studies, most of them speak at least one foreign language, with English being the most popular. Poland has the 11th best English proficiency level in non-English speaking countries with 62% of the population having knowledge of English, placing it at the same rank as Switzerland.[16]
2.4. Infrastructures
The level of infrastructure in the host country (roads, ports, airports, telecommunications networks, as well as cost and availability of energy) have a crucial impact on the cost and efficiency of production and transport services. In order to attract foreign investment, host countries must ensure that their infrastructures are modern and, above all, properly functioning. Whatever may be a country’s assets in terms of investment, it will have difficulty attracting investors if its infrastructures are inefficient. Poland’s LPI index of “quality of trade and transport related infrastructures” is 3.21, placing it above Iceland (3.17) and Estonia (3,10).[17] According to the European Commission, Poland’s Infrastructure’s score is close to the EU average in terms of efficiency of air transport services, and even surpasses the average when it comes to timeliness of shipments.
Furthermore, the future developments of the Polish infrastructures look very promising, as the European Fund for Strategic Investments (EFSI) amounted to €4.4 billion in September 2020, with as many as 65 approved projects financed by the European Investment Bank (EIB)[18]. However, the geographical disparities of infrastructures in Poland are particularly large, the Western Voivodeships being far more developed than the East, notably in terms of quality roads and train rails.
This is why the Polish Government announced that it would invest PLN 16 bln zloty (around EUR 3,5 bln) in the railways of the Eastern regions, in order to reduce development gaps between Voivodeships and harmonise the interregional transportation.[19] Poland’s infrastructures generally seem to develop very quickly, which is bound to further reassure investors.
2.5. Geography
Poland’s central geographical position is very advantageous: it makes it a crossroad between the West and the East of Europe, which allows Western companies a potential expansion in Asia. Moreover, there are more than 250 million potential consumers within a radius of 1,000 km around Poland.[20]
2.6. Political stability
This is a fundamental aspect of the investment decision. For fear of incurring heavy losses, investors will refuse to risk their capital in an environment they consider unstable. On the other hand, in a stable political environment, they are confident that the “rules of the game” or legislation governing their investments and the markets in which they operate will remain more or less unchanged for a relatively long period of time. Poland’s Political stability index is of 0,52, placing Poland at the same rank as the United Kingdom, and above Belgium (0,48), and France (0,31).[21] More importantly, Poland’s well-diversified economy and relative food auto-sufficiency reduces its vulnerability to external shocks, in spite of the fact that it relies heavily on the EU as an export market.
2.7. Favourable government measures
Within the framework of its regional development, Poland opted in 1994 for a special tool to attract new foreign investors: Special Economic Zones (SEZs), which are parts of the Polish territory in which businesses can benefit from positive deregulations.[22] The main benefit for investors is the partial exemptions from the corporate income tax rate (CIT), which amounts to 19% on the rest of the Polish territory[23]. Apart from attracting foreign investors, these zones are made to aid the less developed regions. Therefore, the exemptions are partly proportional to its level of development – it ranges from 10% of exemption in Warsaw, to 50% in poorer Voivodeships like Lubelskie[24].
In 2011, Poland launched a programme to support foreign investments that are considered as of “major importance” to the economy of Poland: the “Polish Investment Zone Act on support for new investments”. This act amended the exemption of the CIT to extend it even outside of the SEZs in some conditions, and now favours the establishment of new enterprises.
Moreover, the Polish Government established a new type of aid, which is designed to define the prioritised sectors (such as the electronics, aviation, biotechnology sectors), and to favour those who invest large amounts in them, which are crucial to the Polish economy: the MASP.[25]
2.8. The Polish consumer market
Poland is the largest market in the CEECs in terms of population (almost 39 million inhabitants). Moreover, it has a Purchasing Power Index of 59,6, which is the highest in the CEE region after Estonia (71.30), Slovenia (66,31), and the Czech Republic (62,82)[26]. Poland’s large market of consumers is a clear strategic commercial outlet for foreign companies.
Conclusion
Following the fall of the communist regime in Poland and the subsequent liberalisation policies of January 1990, all governments in place have advocated the opening of its economy to foreign investors. This tendency has consolidated with Poland’s accession into the European Union in 2004, which reinforced its effort to create an attractive environment to investors. During the period between 1994 and 2019, Poland has become one of the leaders in the CEE region in terms of outsourcing, especially in the domain of IT, and has shown particularly efficient in hosting foreign investors’ offshoring initiatives. The conditions that are offered by this country, such as its particularly strategic geographical location, its inexpensive and qualified workforce and its favourable political measures have distinguished it from its neighbouring nations.
Bibliography
Eurofound (2016), ERM annual report 2016: Globalisation slowdown? Recent evidence of offshoring and reshoring in Europe, Publications Office of the European Union, Luxembourg
Ec.europa.eu. 2020. Hourly Labour Costs – Statistics Explained. [online] Available at: <https://ec.europa.eu/eurostat/statistics-explained/index.php/Hourly_labour_costs> [Accessed 30 December 2020].
Data.worldbank.org. 2020. Foreign Direct Investment, Net Inflows (Bop, Current US$) – European Union | Data. [online] Available at: <https://data.worldbank.org/indicator/BX.KLT.DINV.CD.WD?end=2019&locations=EU&most_recent_value_desc=false&start=1970&view=chart> [Accessed 30 December 2020].
Minerstertwo Gospodarki, 2017. Bezpośrednie inwestycje zagraniczne w wybranych województwach Polski, analiza porównawcza,. p.9
Slowik, C., 2020. Why Poland Is One Of The Best Places To Outsource Your Software Development. [online] Software House That Helps You Innovate – Neoteric. Available at: <https://neoteric.eu/blog/why-poland-is-one-of-the-best-places-to-outsource-software-development/> [Accessed 30 December 2020].
Data.worldbank.org. 2020. GDP Growth (Annual %) – Poland | Data. [online] Available at: <https://data.worldbank.org/indicator/NY.GDP.MKTP.KD.ZG?locations=PL> [Accessed 30 December 2020].
Obserwator Finansowy: ekonomia, debata, Polska, świat. 2020. Poland Had The Biggest GDP Per Capita Growth In The OECD And In Europe | Obserwator Finansowy: Ekonomia, Debata, Polska, Świat. [online] Available at: <https://www.obserwatorfinansowy.pl/in-english/macroeconomics/poland-had-the-biggest-gdp-per-capita-growth-in-the-oecd-and-in-europe/> [Accessed 30 December 2020].
Ministry of Science and Higher Education. 2020. Report: The Percentage Of Poles With Higher Education Is Close To The OECD Average – Ministry Of Science And Higher Education – Gov.Pl Website. [online] Available at: <https://www.gov.pl/web/science/report-the-percentage-of-poles-with-higher-education-is-close-to-the-oecd-average> [Accessed 30 December 2].
Statista. 2020. Share Of Population With Knowledge Of English In Non-Native European Countries As Of March 2019. [online] Available at: <https://www.statista.com/statistics/990547/countries-in-europe-for-english/> [Accessed 30 December 2020].
Data.worldbank.org. 2020. Logistics Performance Index: Quality Of Trade And Transport-Related Infrastructure (1=Low To 5=High) – European Union | Data. [online] Available at: <https://data.worldbank.org/indicator/LP.LPI.INFR.XQ?locations=EU&most_recent_value_desc=false> [Accessed 30 December 2020].European Commission – European Commission. 2020. Investment Plan: Poland. [online] Available at: <https://ec.europa.eu/commission/strategy/priorities-2019-2024/jobs-growth-and-investment/investment-plan-europe/investment-plan-results/investment-plan-poland_en> [Accessed 30 December 2020].
Polandin. 2020. Poland To Invest Billions In Rail Infrastructure By 2023. [online] Available at: <https://polandin.com/37735443/poland-to-invest-billions-in-rail-infrastructure-by-2023> [Accessed 30 December 2020].
European Company Formation | Company Registration Europe. 2020. Poland Lowers Corporate Tax Rate To 9% From 2019. [online] Available at: <https://www.eurocompanyformations.com/blog/poland-lowers-corporate-tax-rate-to-9-from> [Accessed 30 December 2020].
TheGlobalEconomy.com. 2020. Political Stability By Country, Around The World | Theglobaleconomy.Com. [online] Available at: <https://www.theglobaleconomy.com/rankings/wb_political_stability/> [Accessed 30 December 2020].
Kiejstut Żagun, Mariusz Strojny, Dorota Klimczak, Marcin Mańkowski, A guide to special economic zones in Poland, KPMG, 2009, p.13
Paih.gov.pl. 2020. PAIH | Polish Investment Zone Act On Support For New Investments. [online] Available at: <https://www.paih.gov.pl/why_poland/Polish_Investment_Zone#1> [Accessed 30 December 2020]. Investment Zone#1
Ernst & Young, MULTI-ANNUAL SUPPORT PROGRAMME FOR LARGE INVESTMENTS IN POLAND, Business Winter in Poland, 2019, p.15
Numbeo.com. 2020. Purchasing Power Index By Country 2020. [online] Available at: <https://www.numbeo.com/quality-of-life/rankings_by_country.jsp?title=2020&displayColumn=1> [Accessed 30 December 2020].
- Eurofound (2016), ERM annual report 2016: Globalisation slowdown? Recent evidence of offshoring and reshoring in Europe, Publications Office of the European Union, Luxembourg ↑
- Michalat 2007 (à mettre en sources) ↑
- Data.worldbank.org. 2020. Foreign Direct Investment, Net Inflows (Bop, Current US$) – European Union | Data. [online] Available at: <https://data.worldbank.org/indicator/BX.KLT.DINV.CD.WD?end=2019&locations=EU&most_recent_value_desc=false&start=1970&view=chart> [Accessed 30 December 2020]. ↑
- Ec.europa.eu. 2020. Hourly Labour Costs – Statistics Explained. [online] Available at: <https://ec.europa.eu/eurostat/statistics-explained/index.php/Hourly_labour_costs> [Accessed 30 December 2020]. ↑
- Eurofound (2016), ERM annual report 2016: Globalisation slowdown? Recent evidence of offshoring and reshoring in Europe, Publications Office of the European Union, Luxembourg ↑
- Eurofound (2016), ERM annual report 2016: Globalisation slowdown? Recent evidence of offshoring and reshoring in Europe, Publications Office of the European Union, Luxembourg ↑
- Minerstertwo Gospodarki, 2017. Bezpośrednie inwestycje zagraniczne w wybranych województwach Polski, analiza porównawcza,. p.9 ↑
- https://www.cbi.eu/market-information/outsourcing/trade-statistics ↑
- https://www.statista.com/forecasts/963931/it-outsourcing-services-revenue-in-europe ↑
- Piotrowicz, W. and Kedziora, D., 2018. Outsourcing of Information Technology and Business Processes in Poland: Motivations and Environmental Factors. Managing Global Transitions, 16(4), pp.307-333. ↑
- Slowik, C., 2020. Why Poland Is One Of The Best Places To Outsource Your Software Development. [online] Software House That Helps You Innovate – Neoteric. Available at: <https://neoteric.eu/blog/why-poland-is-one-of-the-best-places-to-outsource-software-development/> [Accessed 30 December 2020]. ↑
- https://www.researchgate.net/publication/5223023_Governance_Infrastructure_and_US_Foreign_Direct_Investment , page 3 ↑
- Data.worldbank.org. 2020. GDP Growth (Annual %) – Poland | Data. [online] Available at: <https://data.worldbank.org/indicator/NY.GDP.MKTP.KD.ZG?locations=PL> [Accessed 30 December 2020]. ↑
- Obserwator Finansowy: ekonomia, debata, Polska, świat. 2020. Poland Had The Biggest GDP Per Capita Growth In The OECD And In Europe | Obserwator Finansowy: Ekonomia, Debata, Polska, Świat. [online] Available at: <https://www.obserwatorfinansowy.pl/in-english/macroeconomics/poland-had-the-biggest-gdp-per-capita-growth-in-the-oecd-and-in-europe/> [Accessed 30 December 2020]. ↑
- Ministry of Science and Higher Education. 2020. Report: The Percentage Of Poles With Higher Education Is Close To The OECD Average – Ministry Of Science And Higher Education – Gov.Pl Website. [online] Available at: <https://www.gov.pl/web/science/report-the-percentage-of-poles-with-higher-education-is-close-to-the-oecd-average> [Accessed 30 December 2020]. ↑
- Statista. 2020. Share Of Population With Knowledge Of English In Non-Native European Countries As Of March 2019. [online] Available at: <https://www.statista.com/statistics/990547/countries-in-europe-for-english/> [Accessed 30 December 2020]. ↑
- Data.worldbank.org. 2020. Logistics Performance Index: Quality Of Trade And Transport-Related Infrastructure (1=Low To 5=High) – European Union | Data. [online] Available at: <https://data.worldbank.org/indicator/LP.LPI.INFR.XQ?locations=EU&most_recent_value_desc=false> [Accessed 30 December 2020]. ↑
- European Commission – European Commission. 2020. Investment Plan: Poland. [online] Available at: <https://ec.europa.eu/commission/strategy/priorities-2019-2024/jobs-growth-and-investment/investment-plan-europe/investment-plan-results/investment-plan-poland_en> [Accessed 30 December 2020]. ↑
- Polandin. 2020. Poland To Invest Billions In Rail Infrastructure By 2023. [online] Available at: <https://polandin.com/37735443/poland-to-invest-billions-in-rail-infrastructure-by-2023> [Accessed 30 December 2020]. ↑
- European Company Formation | Company Registration Europe. 2020. Poland Lowers Corporate Tax Rate To 9% From 2019. [online] Available at: <https://www.eurocompanyformations.com/blog/poland-lowers-corporate-tax-rate-to-9-from> [Accessed 30 December 2020]. ↑
- TheGlobalEconomy.com. 2020. Political Stability By Country, Around The World | Theglobaleconomy.Com. [online] Available at: <https://www.theglobaleconomy.com/rankings/wb_political_stability/> [Accessed 30 December 2020]. ↑
- Kiejstut Żagun, Mariusz Strojny, Dorota Klimczak, Marcin Mańkowski, A guide to special economic zones in Poland, KPMG, 2009, p.13 ↑
- Kiejstut Żagun, Mariusz Strojny, Dorota Klimczak, Marcin Mańkowski, A guide to special economic zones in Poland, KPMG, 2009, p.17 ↑
- Paih.gov.pl. 2020. PAIH | Polish Investment Zone Act On Support For New Investments. [online] Available at: <https://www.paih.gov.pl/why_poland/Polish_Investment_Zone#1> [Accessed 30 December 2020]. Investment Zone#1 ↑
- Ernst & Young, MULTI-ANNUAL SUPPORT PROGRAMME FOR LARGE INVESTMENTS IN POLAND, Business Winter in Poland, 2019, p.15 ↑
- Numbeo.com. 2020. Purchasing Power Index By Country 2020. [online] Available at: <https://www.numbeo.com/quality-of-life/rankings_by_country.jsp?title=2020&displayColumn=1> [Accessed 30 December 2020]. ↑