


A brief overview of Poland’s positive dynamic in employment and GDP per capita PPP. In 10 years, Poland increased its share of the EU’s GDP by 0,7% (from 3,3% to 4%). This year, the Central European “Green Island” was determined to continue this positive dynamic, and seized the opportunity of the COVID19 crisis to “catch up” with the rest of the EU even faster. Moreover, Poland has shown exceptionally positive figures in the dynamics of employment and GDP per capita PPP.
Evolution in Employment
Employment in Poland increased by 0.5% year-on-year in the third quarter, with employees working 0.9% more hours. This is unique among large European countries, where these figures have all been falling. In fact, Poland’s employment figures have already returned to those of before the pandemic. Only two EU countries apart from Poland have observed a positive evolution in employment: Luxemburg and Malta.
The Polish Green Island
In the third quarter alone, employment in the Polish economy grew by 361 000 people. In 2020 as a whole, it grew by 81,000 for 16.57 million inhabitants. For comparison, employment in the EU has fallen by 2% in the same year – with a total of 4.3 million fewer people being employed.
The difference between Poland and other EU countries is even more impressive when comparing employment in terms of hours worked: in Poland, the year-on-year number of hours worked increased by 0.9% year on year, whereas it decreased by 3.7% in the EU.
The 0.5% increase in employment and the 0,9% increase in the number of hours worked increased by 0.9% prove that not only Poland has reacted well to the crisis (among others by temporarily transforming full-time jobs into part-time), but also that workers worked more intensively than a year ago.
Companies are determined to avoid firing employees
Most companies are committed to maintaining their employment levels. These decisions are undoubtedly helped by the announcements made by the government and public administration to support them. The relatively high percentage of companies planning to recruit shows that even during the COVID19 pandemics, it is possible to increase sales while acquiring new clients and introducing new services. Moreover, the salaries in companies with more than 9 employees have increased by 4.7% year on year.
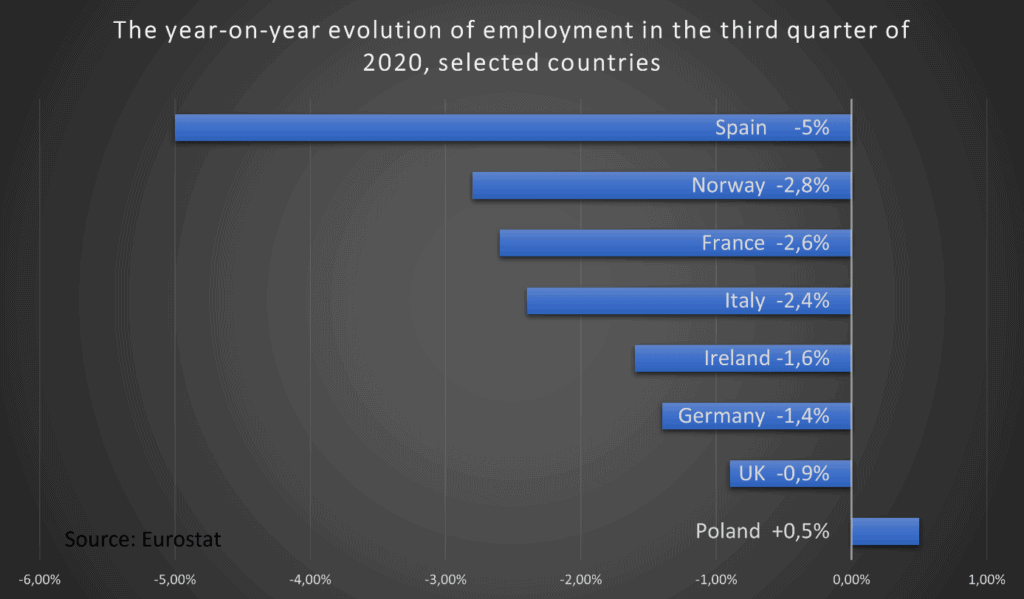
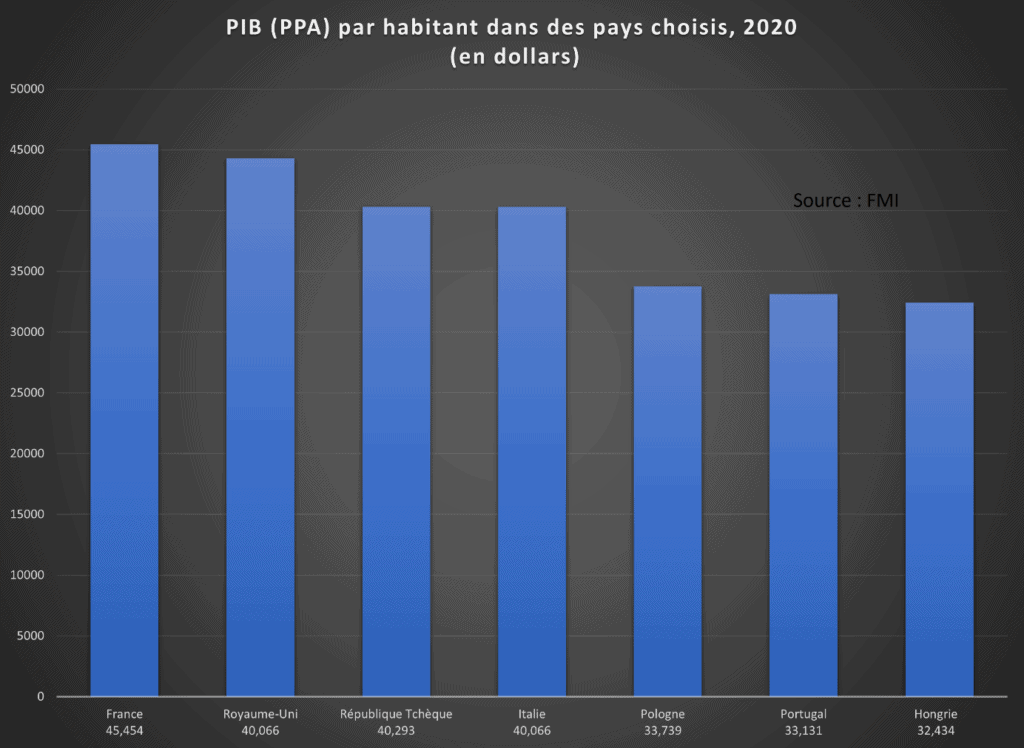
Figure 2: GDP per capita PPP in selected countries, 2020 (countries and figures selected by Blue Europe from the IMF)
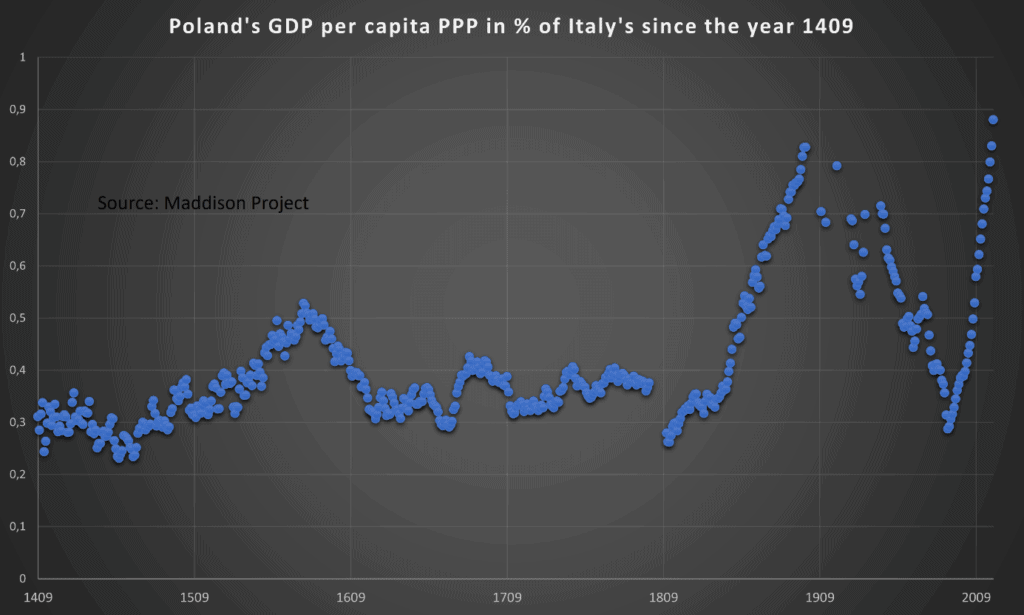
Figure 3: Poland’s GDP per capita PPP in % of Italy’s since the year 1409, selected by Blue Europe from raw data of the study “Maddison Project 2020”
GDP per capita: Central Europe is catching back on the West
According to the IMF estimations for 2020, Poland is increasing its lead in GDP per capita over Portugal. In 2020, Poland had a GDP per capita in purchasing power parity of USD 33 739, while Portugal’s GDP was USD 33 131. This gives Poland the 39th place in the world and Portugal the 40th place in the IMF’s ranking, respectively. This is a strengthening of the position which Poland achieved during the previous year, as at the end of 2019, Poland already overtook Portugal in the aforementioned classification. It is possible that Portugal could lose its position to the rest of Central European countries in the next years. Indeed, this year, in terms of GDP per capita PPP, Portugal is just above Hungary (USD 32 434), Slovakia (USD 32 184), Latvia (USD 30 579) and Romania (USD 30 141).
The Czechs are doing even better, overtaking Italy and Spain. Poland’s southern neighbour boast a GDP per capita PPP of USD 40,293. Italians, on the other hand, have a GDP per capita of USD 40,066. In this sector, Czech Republic’s result is the best in Central Europe. It should be noted, however, that since the collapse of the socialist system, the Czechs have been brilliant in terms of economic development, as can still be seen today.
These figures confirm a tendency showing that Central Europe is on the path of slowly overtaking Southern Europe economically.
According to data from “Maddison Project”, Poland’s GDP per capita in relation to Italy’s has been the highest since at least the year 1400. For nearly 400 years from 1400 to 1800, Poland’s GDP per capita accounted for about 40 percent of the Italian one (with a short and slight increase to 50 percent at the end of the 16th century). In 2020, this score went up to the historical value of 88%.
However, when analysing this data, it should be borne in mind that although the GDP per capita PPP might be the best indicator for comparing for comparing the wealth of a society, it does not consider issues such as income distribution or quality of life. This, in turn, makes this indicator not entirely effective.